15 Analizar datos de loggers de temperatura
En estudios de biología, ecología, o agronomía, frecuentemente usamos datos de temperatura de dataloggers. En este estudio vamos a ver como analizar esos datos usando datos de temperatura del altiplano Boliviano cerca de la ciudad de El Alto. El primer paso es transformar los datos del datalogger en un formato que sea fácil de leer para R. Usaremos un archivo CSV y la función read.table(). El archivo se puede descargar desde el sitio web del libro en GitHub (https://github.com/frareb/myRBook_SP/blob/master/myFiles/E05C13.csv ; el archivo se puede leer desde su destino en GitHub https://raw.githubusercontent.com/frareb/myRBook_SP/master/myFiles/E05C13.csv).
bdd <- read.table("myFiles/E05C13.csv", skip = 1, header = TRUE,
  sep = ",", dec = ".", stringsAsFactors = FALSE)
# Desde GitHub:
# bdd <- read.table("https://raw.githubusercontent.com/frareb/myRBook_SP/master/myFiles/E05C13.csv",
#   skip = 1, header = TRUE, sep = ",", dec = ".", stringsAsFactors = FALSE)
colnames(bdd) <- c("id", "date", "temp")
head(bdd)
## id date temp
## 1 1 11/12/15 23:00:00 4.973
## 2 2 11/12/15 23:30:00 4.766
## 3 3 11/13/15 00:00:00 4.844
## 4 4 11/13/15 00:30:00 4.844
## 5 5 11/13/15 01:00:00 5.076
## 6 6 11/13/15 01:30:00 5.282tail(bdd)## id date temp
## 32781 32781 09/25/17 21:00:00 7.091
## 32782 32782 09/25/17 21:30:00 6.914
## 32783 32783 09/25/17 22:00:00 6.813
## 32784 32784 09/25/17 22:30:00 6.611
## 32785 32785 09/25/17 23:00:00 6.331
## 32786 32786 09/25/17 23:30:00 5.385str(bdd)## 'data.frame': 32786 obs. of 3 variables:
## $ id : int 1 2 3 4 5 6 7 8 9 10 ...
## $ date: chr "11/12/15 23:00:00" "11/12/15 23:30:00" "11/13/15 00:00:00" "11/13/15 00:30:00" ...
## $ temp: num 4.97 4.77 4.84 4.84 5.08 ...Podemos observar que la fecha esta al formato character, y que contiene la fecha con el mes, el día, y el año separados con /, un espacio, y la hora con horas de 0 a 24, minutos, y segundos, separados con : (ejemplo: 11/12/15 23:00:00 para el 12 de Noviembre de 2015 a las 11 de la noche). Vamos a separar la información en varios objetos para ver todas las opciones segun el tipo de datos que se puede tener.
Primero vamos a separar la fecha de la hora. Para esto vamos a usar la función strsplit() usando como separador el espacio entre la fecha y la hora.
strsplit("11/12/15 23:00:00", split = " ")## [[1]]
## [1] "11/12/15" "23:00:00"Como indican los corchetes dobles, la función devuelve un objeto en el formato list. Nosotros queremos el vector que corresponde al primer elemento de la list entonces vamos a añadir [[1]].
strsplit("11/12/15 23:00:00", split = " ")[[1]]## [1] "11/12/15" "23:00:00"El primer elemento del vector es la fecha. Para tener todas las fechas vamos a hacer un bucle con la función sapply().
bddDay <- sapply(strsplit(bdd[, 2], split = " "), "[[", 1)
head(bddDay)
## [1] "11/12/15" "11/12/15" "11/13/15" "11/13/15" "11/13/15" "11/13/15"A continuación vamos a necesitar las fechas en el formato Date. Entonces necesitamos transformar el objeto en el formato Date con la función as.Date().
bddDay <- as.Date(sapply(strsplit(bdd[, 2], split = " "), "[[", 1), format = "%m/%d/%y")
head(bddDay)
## [1] "2015-11-12" "2015-11-12" "2015-11-13" "2015-11-13" "2015-11-13"
## [6] "2015-11-13"Vamos a añadir la information al formato Date en nuestro objeto bdd. Con la función str(), podemos ver que el formato de bdd$day es Date.
bdd$day <- bddDay
str(bdd)
## 'data.frame': 32786 obs. of 4 variables:
## $ id : int 1 2 3 4 5 6 7 8 9 10 ...
## $ date: chr "11/12/15 23:00:00" "11/12/15 23:30:00" "11/13/15 00:00:00" "11/13/15 00:30:00" ...
## $ temp: num 4.97 4.77 4.84 4.84 5.08 ...
## $ day : Date, format: "2015-11-12" "2015-11-12" ...Si necesitamos la información del horario, usaremos el formato POSIX con la función as.POSIXct(). Vamos a añadir la information al formato POSIX en nuestro objeto bdd. Con la función str(), podemos ver que el formato de bdd$posix es POSIXct.
bddPosix <- as.POSIXct(bdd$date, format = "%m/%d/%y %H:%M:%S")
head(bddPosix)
## [1] "2015-11-12 23:00:00 CET" "2015-11-12 23:30:00 CET"
## [3] "2015-11-13 00:00:00 CET" "2015-11-13 00:30:00 CET"
## [5] "2015-11-13 01:00:00 CET" "2015-11-13 01:30:00 CET"bdd$posix <- bddPosix
str(bdd)## 'data.frame': 32786 obs. of 5 variables:
## $ id : int 1 2 3 4 5 6 7 8 9 10 ...
## $ date : chr "11/12/15 23:00:00" "11/12/15 23:30:00" "11/13/15 00:00:00" "11/13/15 00:30:00" ...
## $ temp : num 4.97 4.77 4.84 4.84 5.08 ...
## $ day : Date, format: "2015-11-12" "2015-11-12" ...
## $ posix: POSIXct, format: "2015-11-12 23:00:00" "2015-11-12 23:30:00" ...En las funciones as.Date() y as.POSIXct() tenemos que especificar el formato en el cual esta indicado la fecha con el argumento format(format = "%m/%d/%y" y format = "%m/%d/%y %H:%M:%S").
| código | Valor |
|---|---|
| %a | dia de la semana abreviado |
| %A | dia de la semana |
| %b | mes abreviado |
| %B | nombre completo del mes |
| %d | dia del mes (decimal) |
| %j | dia del año (decimal) |
| %m | mes (decimal) |
| %y | año con dos dígitos |
| %Y | año con cuatro dígitos |
| %U | semana del año desde el domingo (decimal) |
| %W | semana del año desde el lunes (decimal) |
| %H | hora 24 |
| %I | hora 12 |
| %M | minuto |
| %S | segundo |
Podemos visualizar los datos con la función plot().
plot(x = bdd$day, y = bdd$temp,
    type = 'l', ylim = c(-15, 40),
    xlab = "Fecha", ylab = "Temperatura (°C)")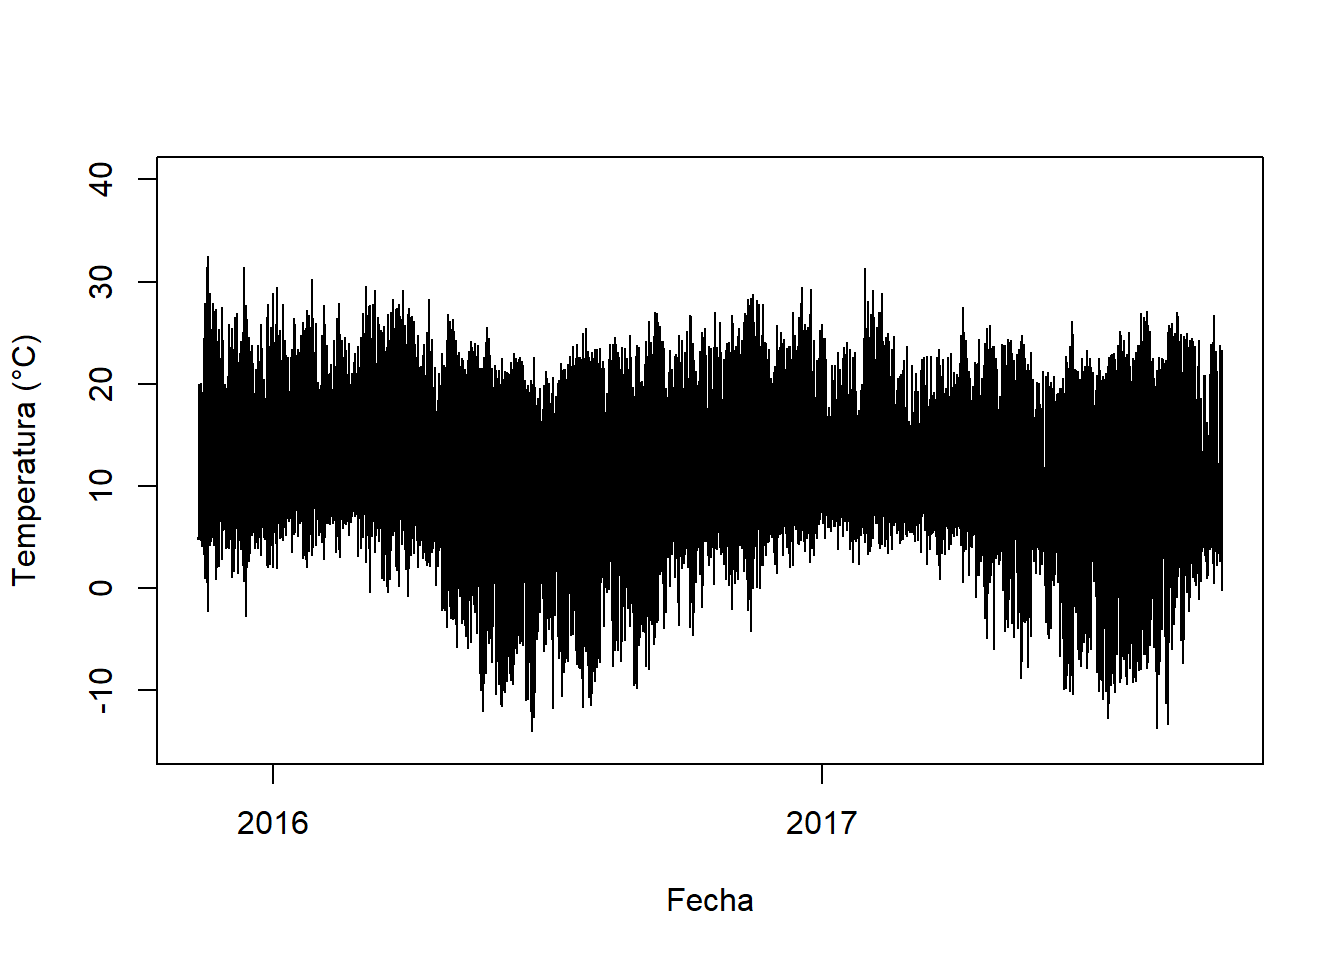
Podemos simplificar la información calculando únicamente las temperaturas mínimas, promedias, y máximas del dia con la función tapply().
tempDayMean <- tapply(bdd$temp, INDEX = bdd$day, FUN = mean)
tempDayMin <- tapply(bdd$temp, INDEX = bdd$day, FUN = min)
tempDayMax <- tapply(bdd$temp, INDEX = bdd$day, FUN = max)
plot(x = as.Date(names(tempDayMean), format = "%Y-%m-%d"),
    y = tempDayMean, type = 'l', ylim = c(-15, 40),
    xlab = "Fecha", ylab = "Temperatura (°C)")
points(as.Date(names(tempDayMin), format = "%Y-%m-%d"),
    y = tempDayMin, type = 'l', col = 4)
points(as.Date(names(tempDayMax), format = "%Y-%m-%d"),
    y = tempDayMax, type = 'l', col = 2)
legend("topright", legend = c("min", "max", "promedio"),
  lty = 1, lwd = 2, col = c(4, 2, 1))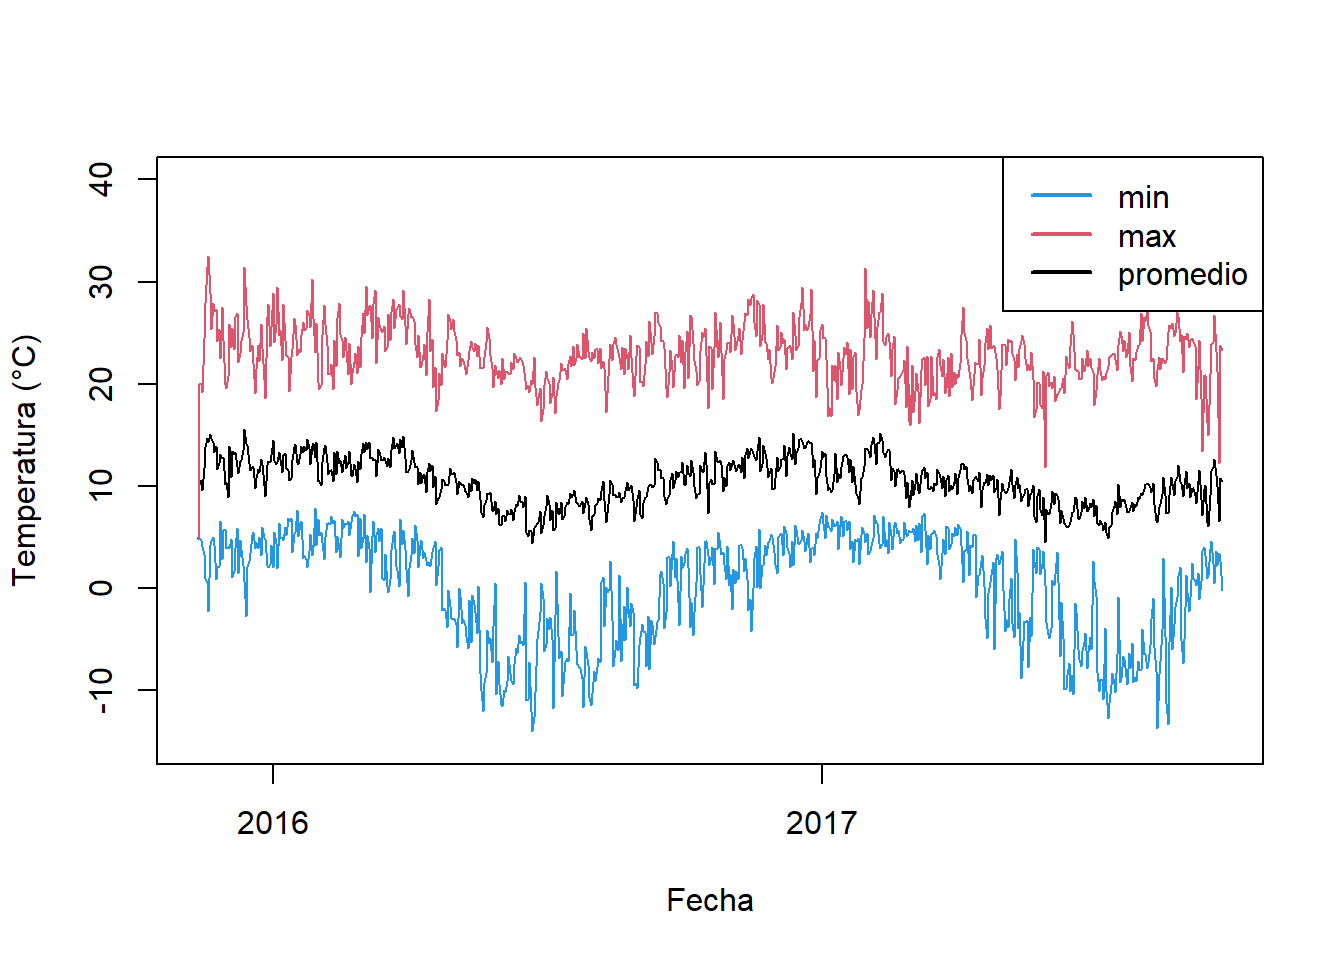
Podemos representar la misma información por semana. Para esto vamos a usar la información de los datos en el formato POSIXct para transformala en semanas.
anoSem <- format(bdd$posix, format = "%Y-%W")
head(anoSem)
## [1] "2015-45" "2015-45" "2015-45" "2015-45" "2015-45" "2015-45"Y despues hacer el gráfico.
tempWeekMean <- tapply(bdd$temp,
  INDEX = format(bdd$posix, format = "%Y-%W-1"), FUN = mean)
tempWeekMin <- tapply(bdd$temp,
  INDEX = format(bdd$posix, format = "%Y-%W-1"), FUN = min)
tempWeekMax <- tapply(bdd$temp,
  INDEX = format(bdd$posix, format = "%Y-%W-1"), FUN = max)
plot(x = as.Date(names(tempWeekMean), format = "%Y-%W-%u"),
    y = tempWeekMean, type = 'l', ylim = c(-15, 40),
    xlab = "Fecha", ylab = "Temperatura (°C)")
points(x = as.Date(names(tempWeekMin), format = "%Y-%W-%u"),
    y = tempWeekMin, type = 'l', col = 4)
points(x = as.Date(names(tempWeekMax), format = "%Y-%W-%u"),
    y = tempWeekMax, type = 'l', col = 2)
legend("topright", legend = c("min", "max", "promedio"),
  lty = 1, lwd = 2, col = c(4, 2, 1))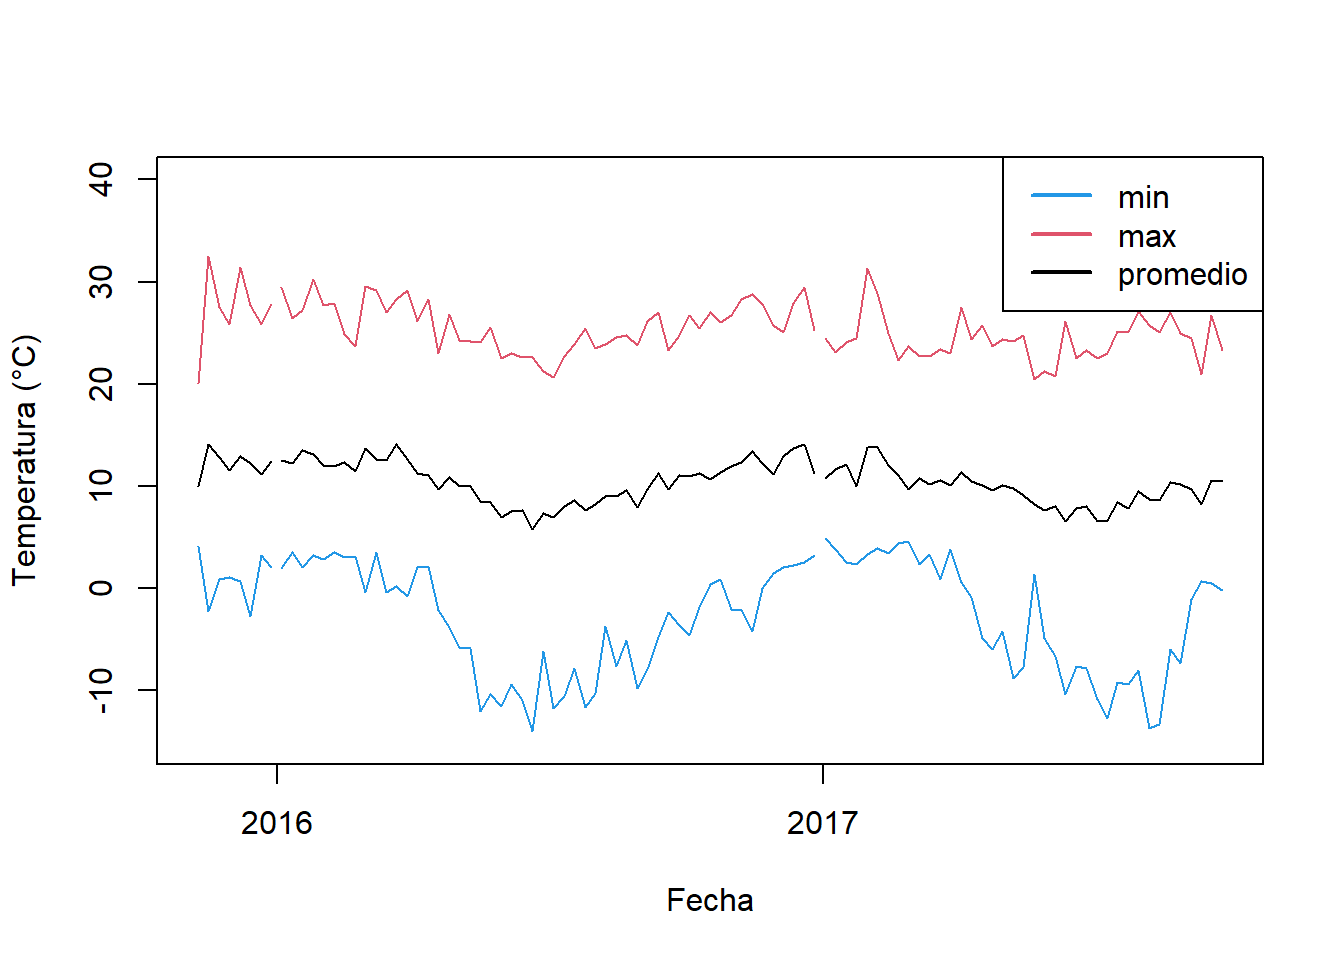
Para no perder la información sobre la variabilidad de la temperatura podemos hacer boxplot en lugar de plot.
boxplot(bdd$temp ~ format(bdd$posix, format = "%Y-%m"), las = 3)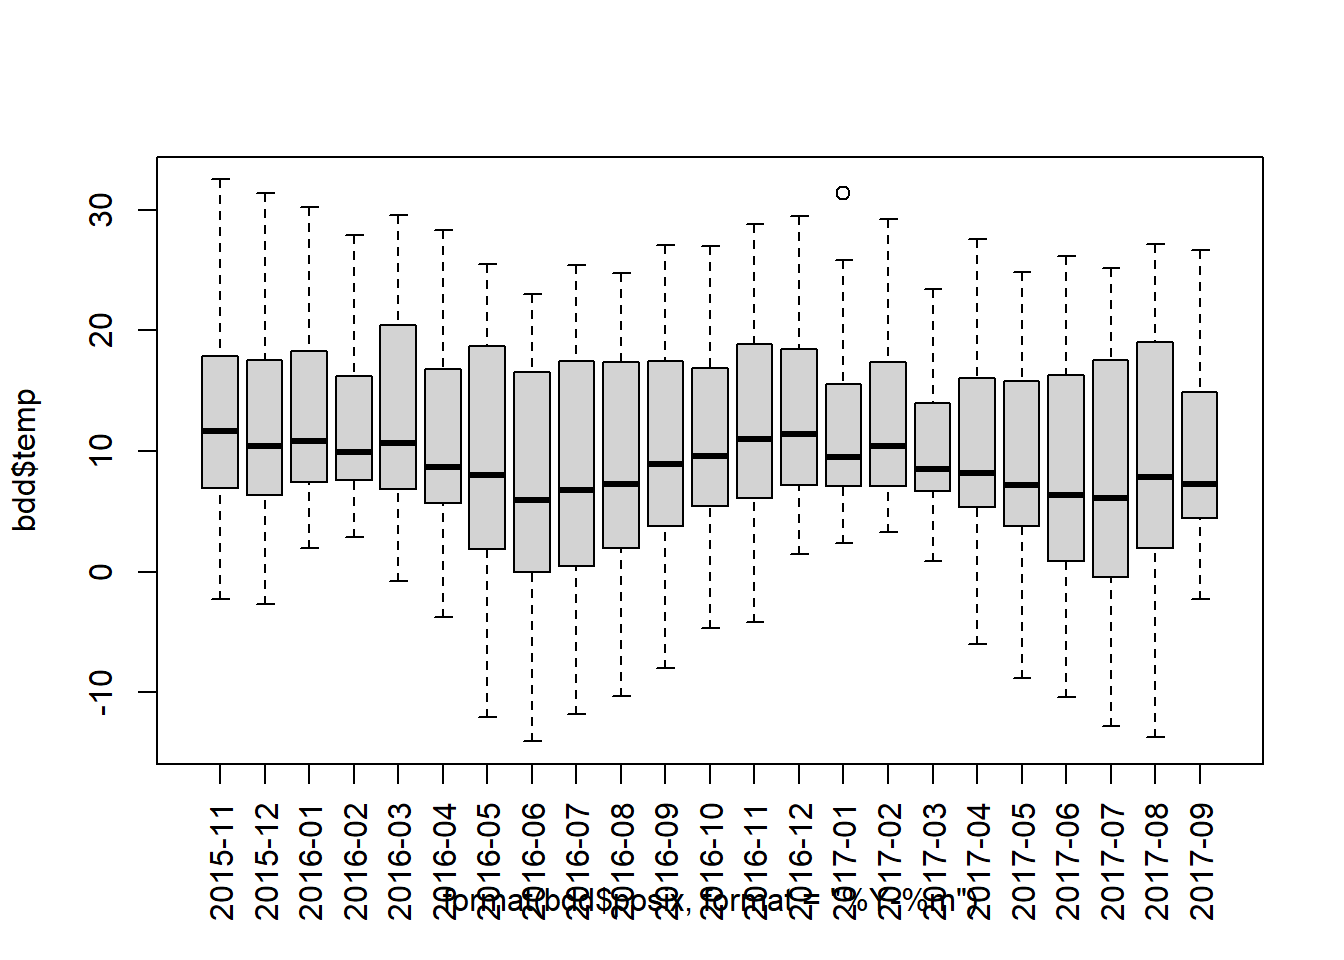
Podemos elegir colores para representar la temperatura promedia. Para esto podemos normalizar la temperatura en numeros integrados entre 1 y 101 y hacer corresponder los numeros en una escala de color del azul al rojo.
tempMonthMean <- tapply(bdd$temp,
  INDEX = format(bdd$posix, format = "%Y-%m"), FUN = mean)
myCol <- colorRampPalette(c("blue", "red"))(101)
tempMeanDayPos <- round(
  (tempMonthMean - min(tempMonthMean)) /
    (max(tempMonthMean) - min(tempMonthMean))*100) + 1
boxplot(bdd$temp ~ format(bdd$posix, format = "%Y-%m"), las = 3,
  col = myCol[tempMeanDayPos])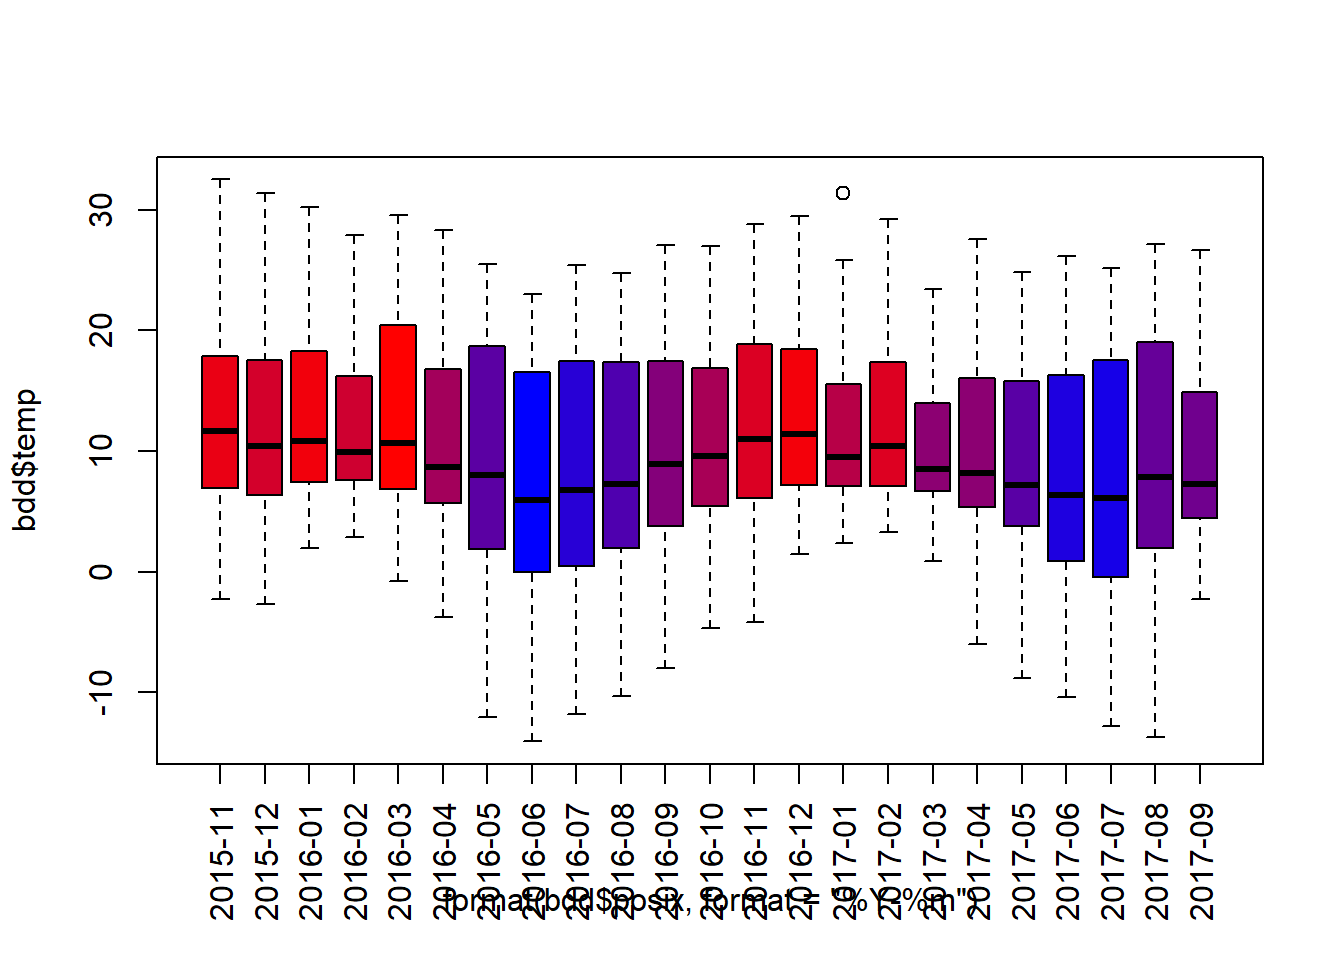
Para los que usan ggplot2:
pkgCheck <- function(x){
    if (!require(x, character.only = TRUE)){
        install.packages(x, dependencies = TRUE)
        if(!require(x, character.only = TRUE)) {
            stop()
        }
    }
}
pkgCheck("ggplot2")

tempMonthMean <- tapply(bdd$temp,
  INDEX = format(bdd$posix, format = "%Y-%m"), FUN = mean)
myCol <- colorRampPalette(c("blue", "red"))(101)
tempMeanDayPos <- round(
  (tempMonthMean - min(tempMonthMean)) /
    (max(tempMonthMean) - min(tempMonthMean))*100) + 1
p01 <- ggplot(data = bdd,
  aes(
    x = posix,
    y = temp,
    group = format(bdd$posix, format = "%Y-%m"))) +
    geom_boxplot(outlier.colour = "black", fill = myCol[tempMeanDayPos])
p01
## Warning: Use of `bdd$posix` is discouraged. Use `posix` instead.## Warning: Removed 4 rows containing missing values (stat_boxplot).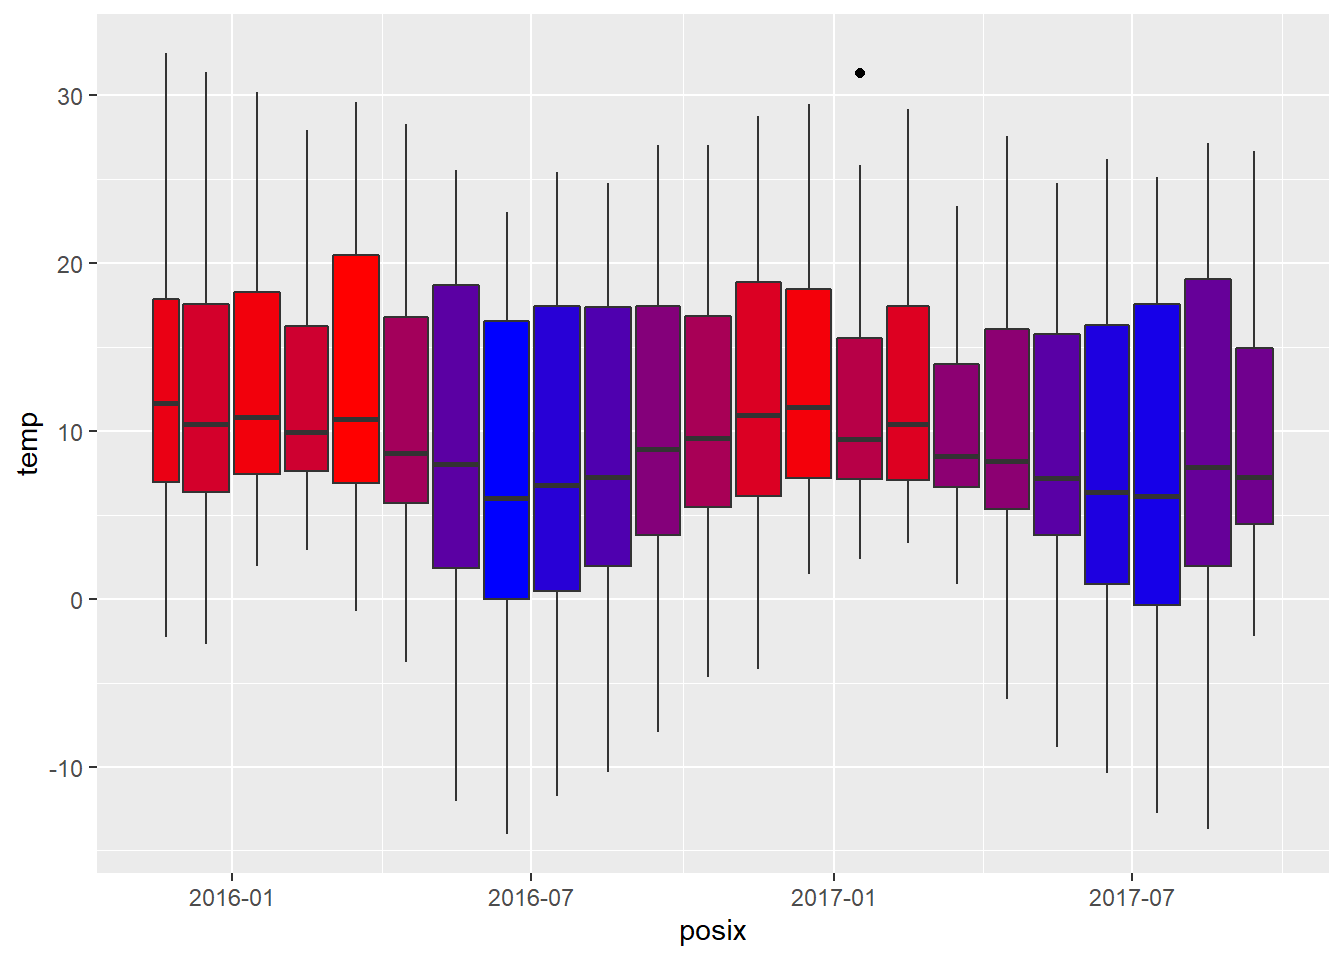
También podemos calcular la diferencia entre la temperatura máxima y la temperatura mínima (variación de temperatura diurna).
tempDayTR <- tempDayMax - tempDayMin
plot(x = as.Date(names(tempDayMean), format = "%Y-%m-%d"),
    y = tempDayTR, type = 'l', ylim = c(5, 45),
    xlab = "Fecha", ylab = "Variación de temperatura diurna (°C)")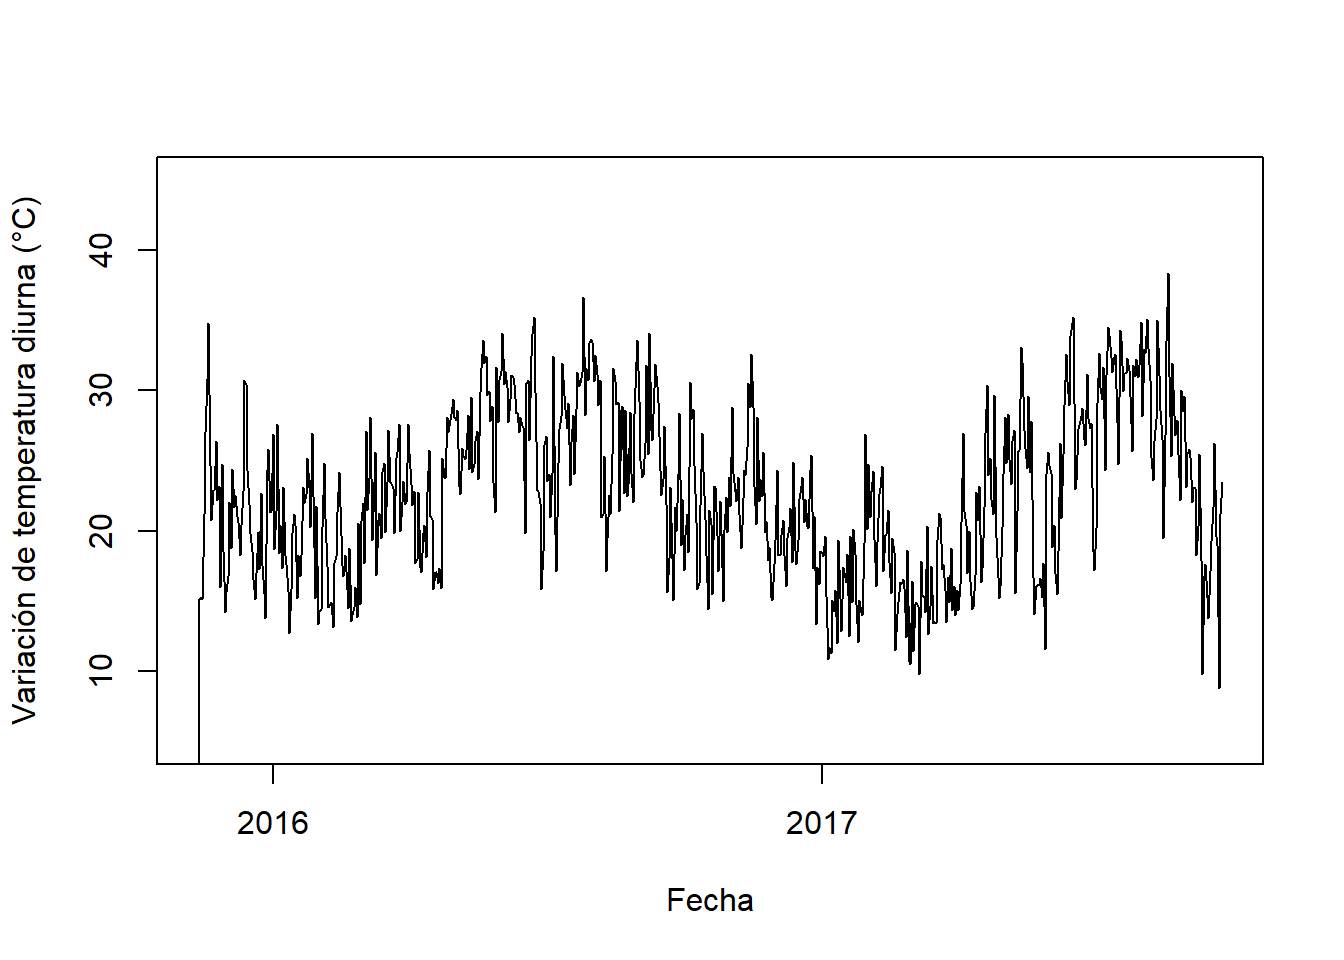
Otra posibilidad es de agrupar los datos para tener la temperatura promedia de un día con la función aggregate() (como alternativa a la función tapply).
tempHourMean <- aggregate(x = bdd$temp,
  by = list(format(bdd$posix, format = "%H:%M")), FUN = mean)
tempHourMin <- aggregate(x = bdd$temp,
  by = list(format(bdd$posix, format = "%H:%M")), FUN = min)
tempHourMax <- aggregate(x = bdd$temp,
  by = list(format(bdd$posix, format = "%H:%M")), FUN = max)
hours <- seq(from = 0, to = 23.5, by = 0.5)
plot(x = hours,
    y = tempHourMean[, 2], type = 'l', ylim = c(-15, 40),
    xlab = "", ylab = "Temperatura (°C)", lwd = 2,
    xaxt = "n", panel.first = {
        abline(v = hours, col = "gray", lty = 2)
        abline(h = 0, lty = 2)
    })
axis(side = 1, at = hours, labels = tempHourMean[, 1], las = 2)
points(x = hours, y = tempHourMin[, 2], type = 'l', col = 4, lwd = 2)
points(x = hours, y = tempHourMax[, 2], type = 'l', col = 2, lwd = 2)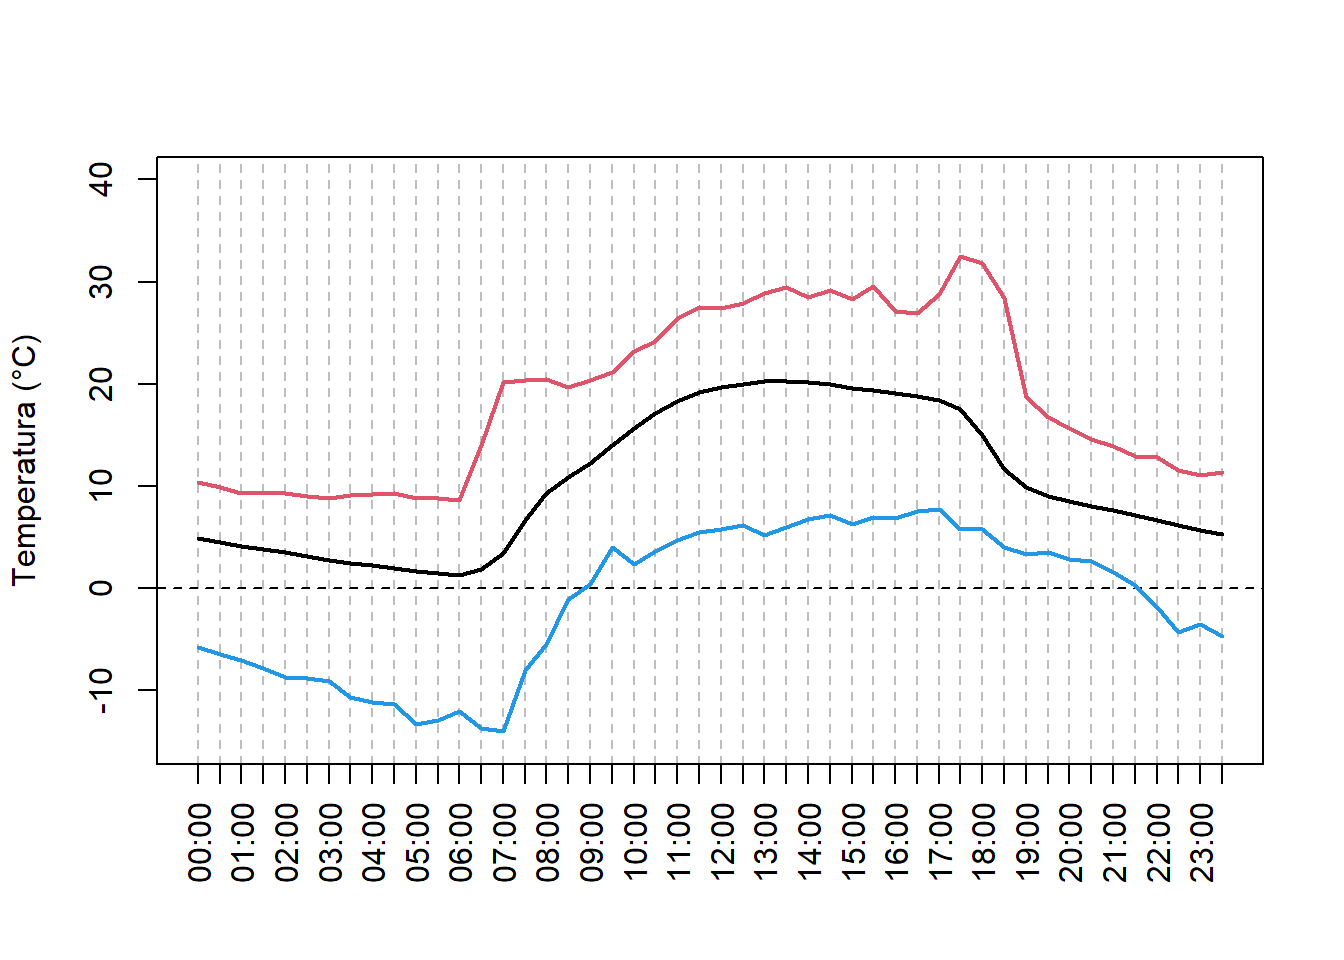
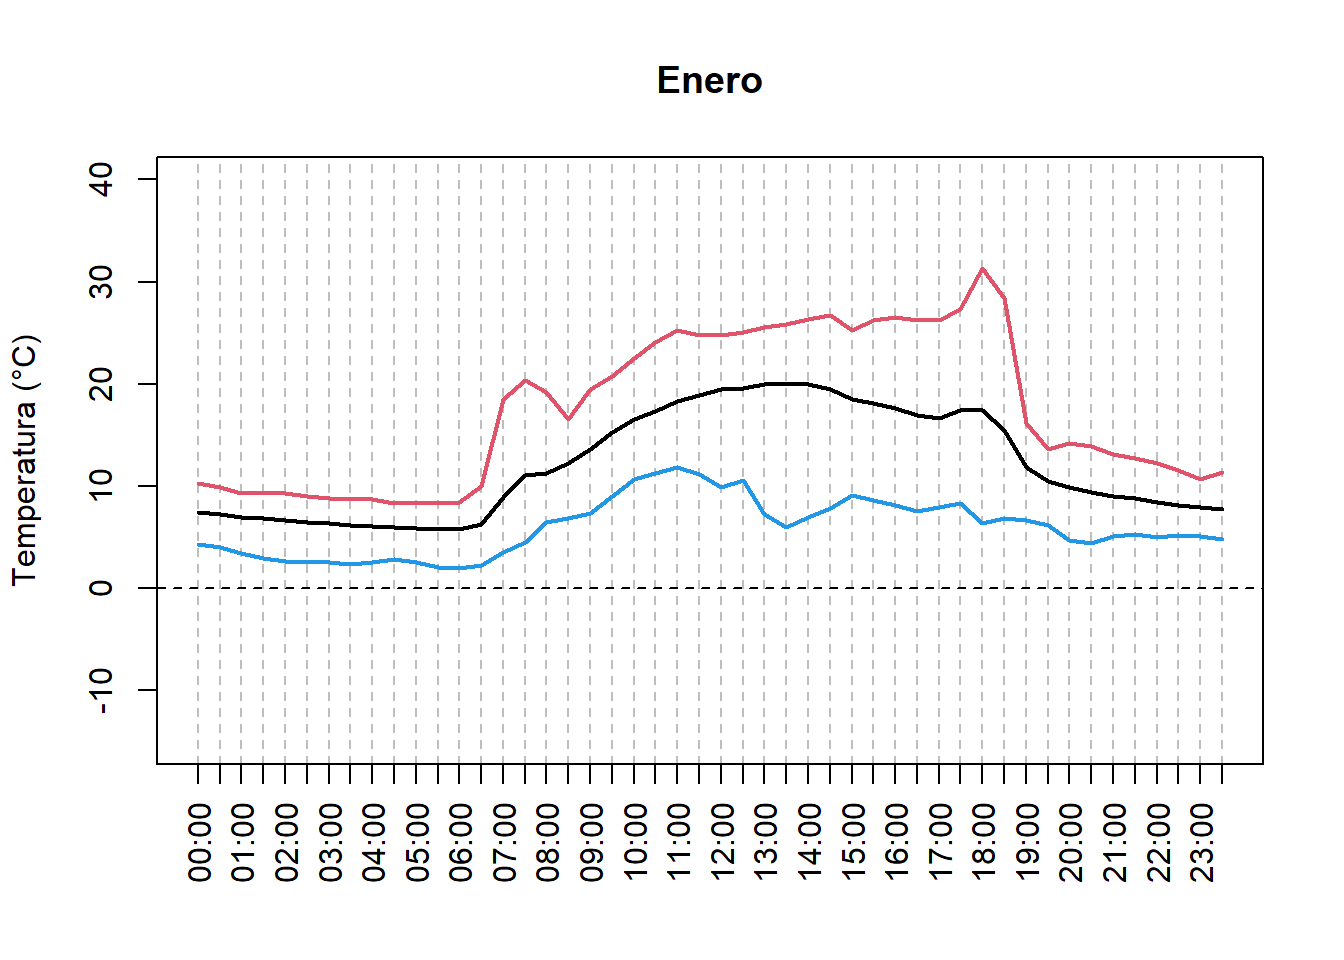
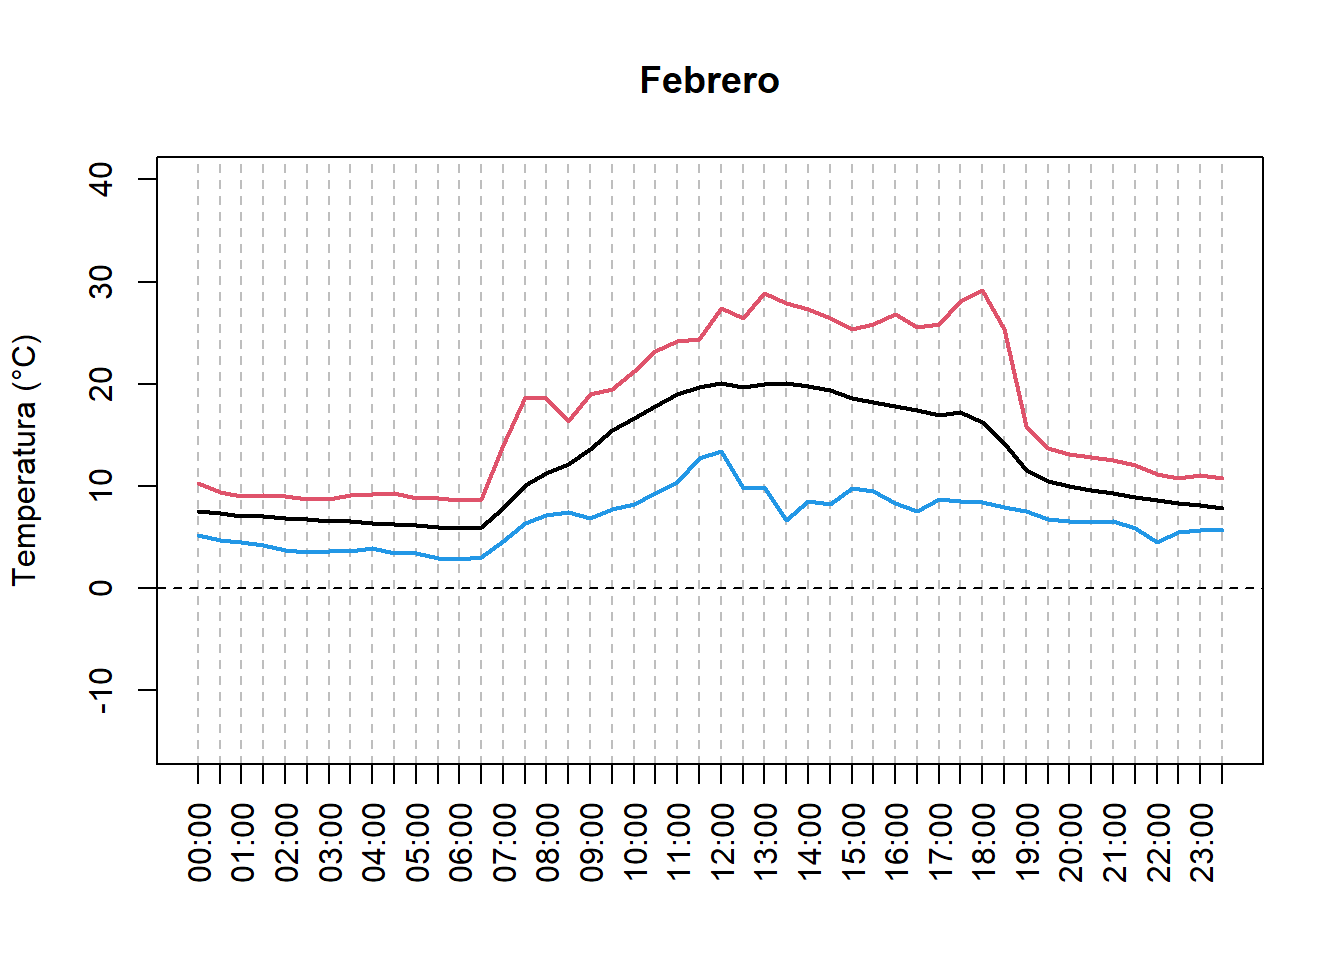
Tambien podemos calcular las temperaturas de los dias para cada mes.
meses <- c("Enero", "Febrero", "Marzo", "Abril", "Mayo", "Junio",
    "Julio", "Agosto", "Septiembre", "Octubre", "Noviembre", "Diciembre")
hours <- seq(from = 0, to = 23.5, by = 0.5)
bddMonth <- format(bdd$day, format = "%m")
tempDayEachMonth <- lapply(sort(unique(bddMonth)), function(myMonth){
    bddX <- bdd[bddMonth == myMonth, ]
    tempHourMean <- aggregate(x = bddX$temp, by = list(format(bddX$posix, format = "%H:%M")), FUN = mean)
    tempHourMin <- aggregate(x = bddX$temp, by = list(format(bddX$posix, format = "%H:%M")), FUN = min)
    tempHourMax <- aggregate(x = bddX$temp, by = list(format(bddX$posix, format = "%H:%M")), FUN = max)
    return(data.frame(tempHourMean, tempHourMin, tempHourMax))
})

# for (i in seq_along(tempDayEachMonth)){ # para todos los meses
for (i in 1:2){ # solo para Enero y Febrero
    plot(x = hours, y = tempDayEachMonth[[i]][, 2],
        type = 'l', ylim = c(-15, 40),
        xlab = "", ylab = "Temperatura (°C)", lwd = 2,
        main = meses[i],
        xaxt = "n", panel.first = {
            abline(v = hours, col = "gray", lty = 2)
            abline(h = 0, lty = 2)
        })
    axis(side = 1, at = hours, labels = tempHourMean[, 1], las = 2)
    points(x = hours, y = tempDayEachMonth[[i]][, 4],
        type = 'l', col = 4, lwd = 2)
    points(x = hours, y = tempDayEachMonth[[i]][, 6],
        type = 'l', col = 2, lwd = 2)
}
O todo en un mismo grafico, y la variación de temperatura diurna para cada mes.
plot(x = hours, y = tempDayEachMonth[[1]][, 2], type = 'n', ylim = c(-10, 35),
    xlab = "", ylab = "Temperatura promedia (°C)",
    xaxt = "n",
    panel.first = {
        abline(v = hours, col = "gray", lty = 2)
        abline(h = 0, lty = 2)
    })
axis(side = 1, at = hours, labels = tempHourMean[, 1], las = 2)
myColors <- c("#A6CEE3", "#1F78B4", "#B2DF8A", "#33A02C", "#FB9A99",
    "#E31A1C", "#FDBF6F", "#FF7F00", "#CAB2D6", "#6A3D9A", "#FFFF99",
    "#B15928")
for (i in seq_along(tempDayEachMonth)){
    points(x = hours,
        y = tempDayEachMonth[[i]][, 2],
        type = 'l', col = myColors[i], lwd = 2)
}
legend("topright", ncol = 4, legend = meses, col = myColors,
    lty = 1, lwd = 2, cex = 0.8)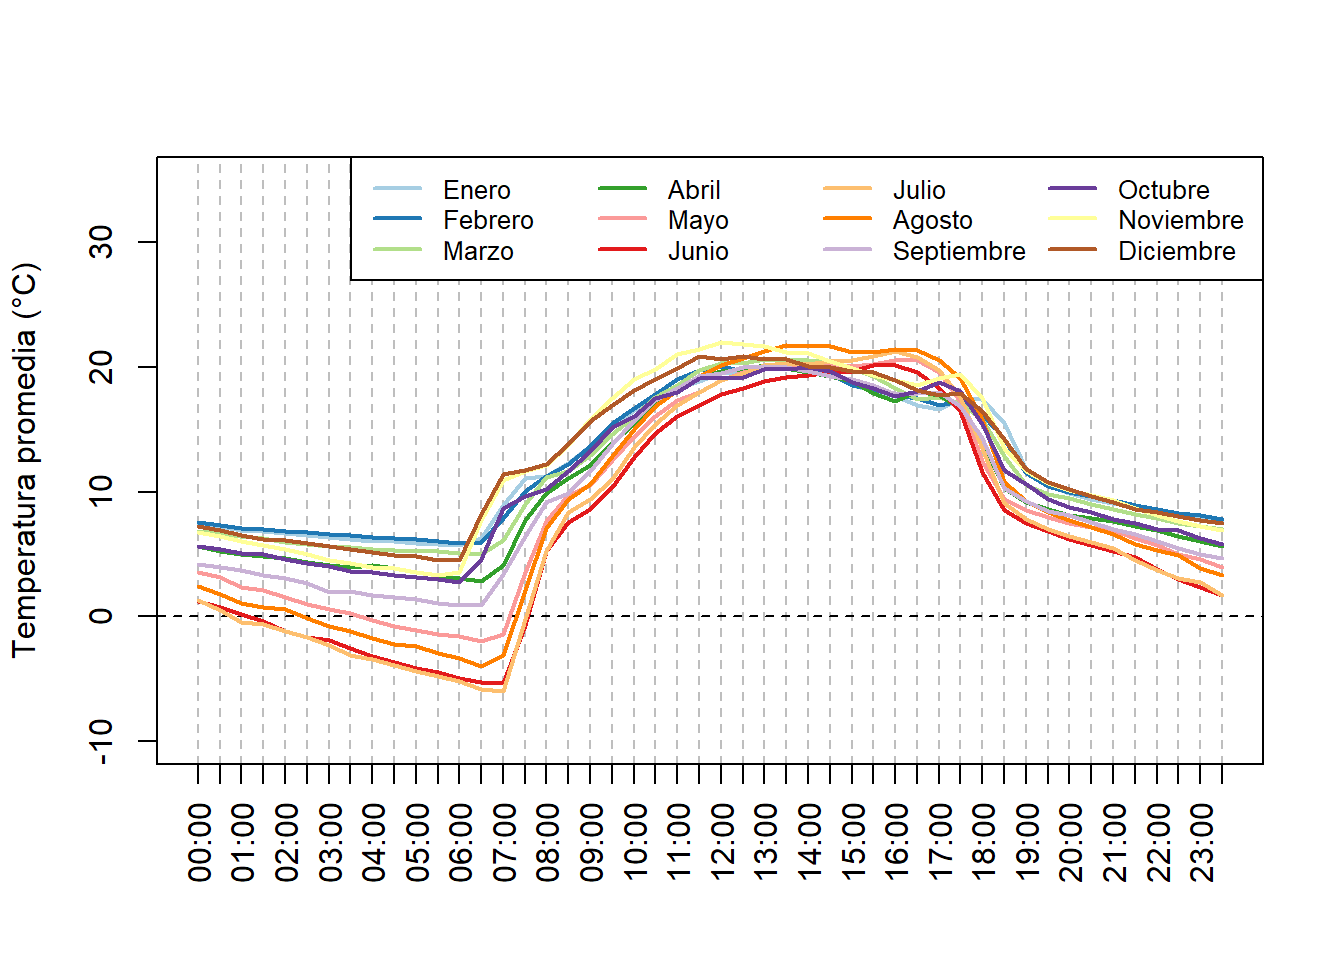
plot(x = hours, y = tempDayEachMonth[[1]][, 2], type = 'n', ylim = c(0, 30),
    xlab = "", ylab = "Variación de temperatura diurna (°C)",
    xaxt = "n",
    panel.first = {
        abline(v = hours, col = "gray", lty = 2)
        abline(h = 0, lty = 2)
    })
axis(side = 1, at = hours, labels = tempHourMean[, 1], las = 2)
myColors <- c("#A6CEE3", "#1F78B4", "#B2DF8A", "#33A02C", "#FB9A99",
    "#E31A1C", "#FDBF6F", "#FF7F00", "#CAB2D6", "#6A3D9A", "#FFFF99",
    "#B15928")
for (i in seq_along(tempDayEachMonth)){
    points(x = hours,
        y = tempDayEachMonth[[i]][, 6] - tempDayEachMonth[[i]][, 4],
        type = 'l', col = myColors[i], lwd = 2)
}
legend("topright", ncol = 4, legend = meses, col = myColors,
    lty = 1, lwd = 2, cex = 0.8)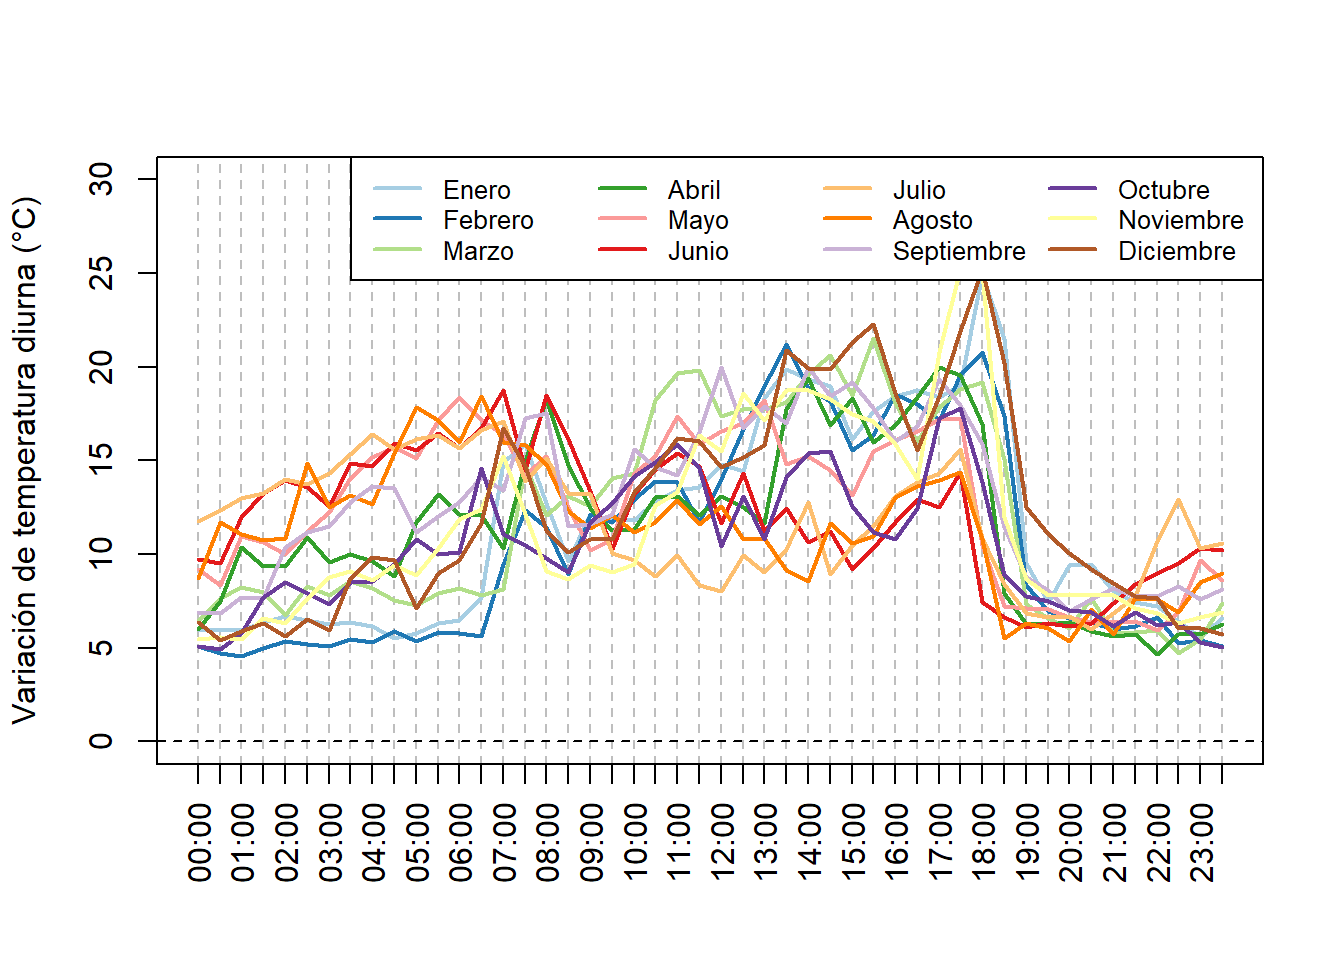
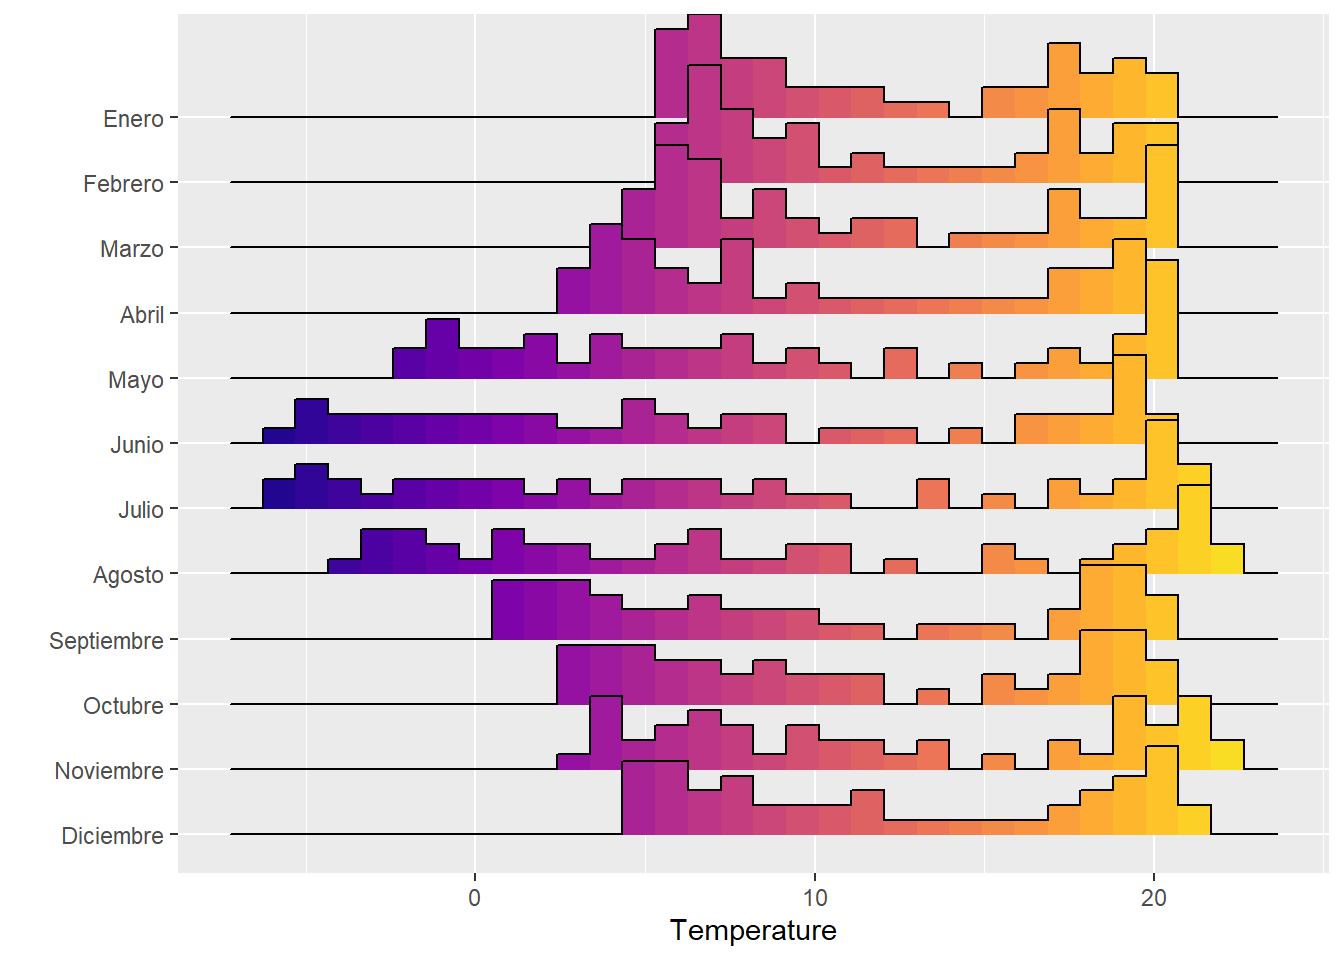
También podemos representar las temperaturas diarias con gráficos “ridgeline” y el package ggplot2 (https://www.data-to-viz.com/graph/ridgeline.html).
pkgCheck <- function(x){
    if (!require(x, character.only = TRUE)){
        install.packages(x, dependencies = TRUE)
        if(!require(x, character.only = TRUE)) {
            stop()
        }
    }
}
pkgCheck("ggplot2")
pkgCheck("ggridges")
## Le chargement a nécessité le package : ggridgespkgCheck("viridis")## Le chargement a nécessité le package : viridis## Le chargement a nécessité le package : viridisLitemeanTemps <- unlist(lapply(tempDayEachMonth, "[[", 2))
labelMonth <- rep(meses, each = 48)
dfTemps <- data.frame(month = labelMonth, value = meanTemps,
stringsAsFactors = FALSE)
dfTemps$month <- factor(dfTemps$month, levels = rev(meses))
p <- ggplot(data = dfTemps, aes(y = month, x = value, fill = ..x..))
p <- p + geom_density_ridges_gradient(stat="binline")
p <- p + scale_fill_viridis(name = "Temp. [°C]", option = "C")
p <- p + xlab("Temperature") + ylab("") +
theme(
legend.position="none",
panel.spacing = unit(0.1, "lines"),
strip.text.x = element_text(size = 8)
)
p## `stat_binline()` using `bins = 30`. Pick better value with `binwidth`.